


Coastal flood risk: Master 2026 Protection
The Rising Tide of Concern
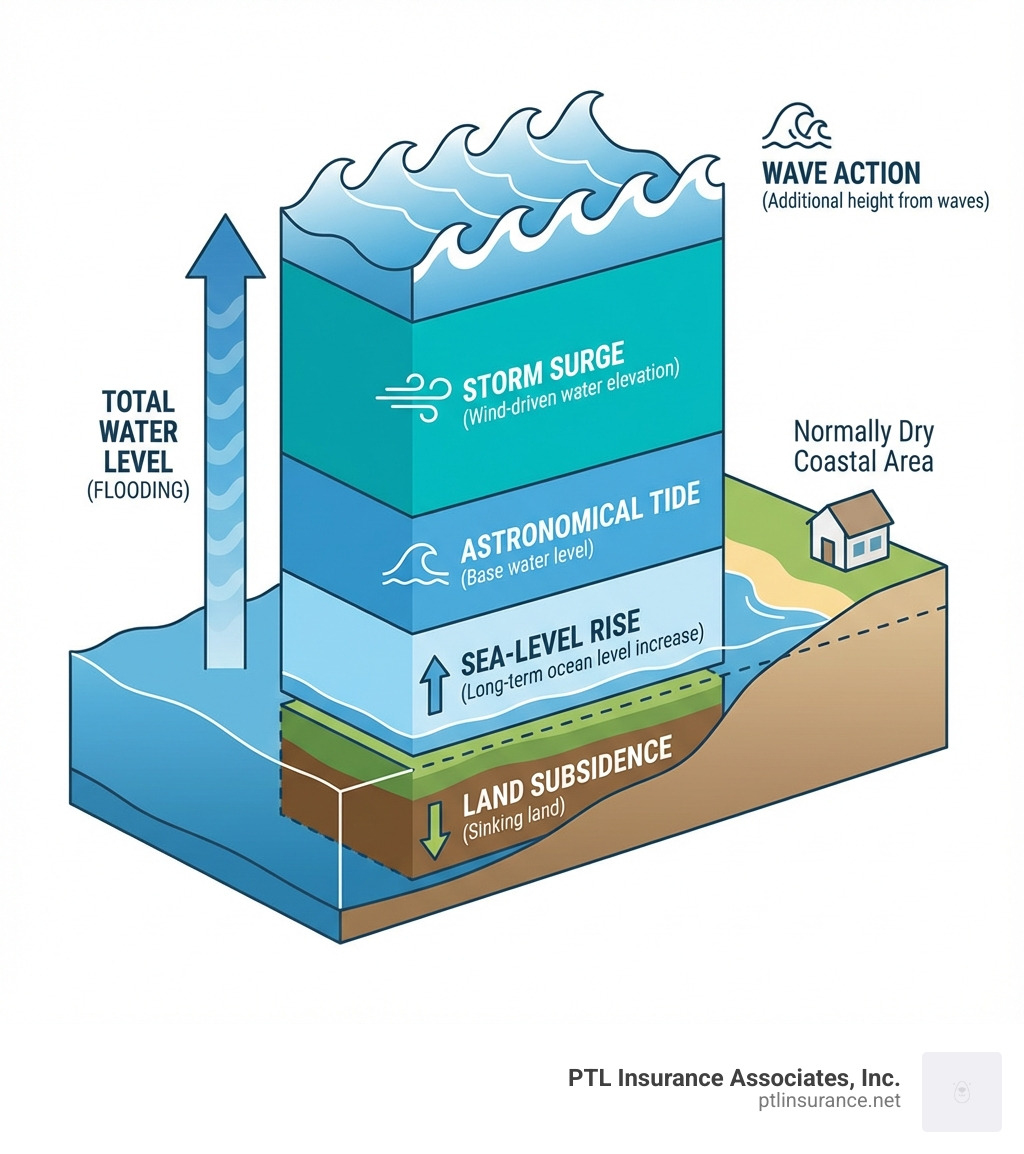
As the image above starkly illustrates, coastal flood risk is the potential for normally dry coastal land to be inundated by water due to high tides, storm surges, sea-level rise, or a combination of these factors. This risk is increasing along coastlines worldwide, driven by climate change and changing storm patterns.
Key Components of Coastal Flood Risk:
- Storm Surge – Water pushed ashore by powerful winds during storms
- High Tide Flooding – Also called “nuisance flooding,” occurs during exceptionally high tides
- Sea-Level Rise – Long-term increase in ocean levels due to warming waters and melting ice
- Wave Action – Additional water height from waves riding atop liftd water levels
- Land Subsidence – Sinking of land that increases relative sea-level rise
The infographic below breaks down how these factors combine to create a total flood event.
For Miami homeowners and business owners, understanding coastal flood risk isn’t just about reading news headlines—it’s about protecting your property, your livelihood, and your financial future. The frequency of high-tide flooding events is accelerating, and what was once considered a rare “100-year flood” may now occur far more often.
The science behind flood prediction has improved dramatically in recent years. Tools like NOAA’s Sea Level Rise Viewer and Climate Central’s CoastalDEM® now provide high-resolution data that reveals which properties face the greatest exposure. These tools account for factors that older maps missed, often showing greater risk than previously understood.
But maps and models are only part of the story. Man-made coastal protections like seawalls can dramatically alter local flood potential, yet most global datasets don’t account for them. Complex bathymetry in bays and estuaries can create localized flood patterns that broad models miss. And critically, local survey data and community observations often reveal risks that no computer model can predict.
I’m Niki Perez, and after years in Real Estate Management Services, I joined PTL Insurance Associates where we help Miami property owners steer Coastal flood risk through proper insurance coverage and risk assessment. Understanding your actual flood exposure—not just what a map says—is the foundation of protecting what you’ve built.
Understanding the Drivers of Coastal Flood Risk
Coastal areas, especially low-lying regions like Miami, are particularly vulnerable to flooding. The primary drivers of Coastal flood risk are a complex interplay of oceanographic, atmospheric, and geological factors, and unfortunately, many of these are projected to intensify in the future.
At the global level, the most significant driver is sea-level rise (SLR). This isn’t a uniform phenomenon; it’s influenced by two main components:
- Thermal Expansion: As oceans warm due to climate change, the water expands, taking up more space.
- Ice Sheet and Glacier Melt: The melting of vast ice sheets in Greenland and Antarctica, along with mountain glaciers, adds water to the oceans.
These global factors contribute to what we call “eustatic sea-level rise.” However, what Miami experiences is “relative sea-level rise,” which also incorporates local factors.
Key Factors Increasing Your Coastal Flood Risk
Let’s break down the specific components that contribute to our escalating Coastal flood risk:
- Sea-Level Rise: As mentioned, this is the long-term trend. The latest sea-level projections, including those from the IPCC’s Sixth Assessment Report (AR6) and the 2022 Sea Level Rise Technical Report from a U.S. government task force, consistently show an upward trajectory. For Florida, this means more frequent and severe high tide flooding and greater storm surge penetration.
- Changing Storm Intensity and Patterns: While it’s complex to directly attribute individual storms to climate change, we are seeing shifts. Warmer ocean waters can fuel more intense hurricanes, increasing the potential for devastating storm surges. These surges are critical components of coastal flooding, pushing vast amounts of water onto land.
- Tides: The regular rise and fall of ocean water due to gravitational forces from the moon and sun. When exceptionally high tides, often called “king tides,” coincide with other factors like minor storms or liftd sea levels, they can lead to what’s known as “nuisance flooding” or “high tide flooding.” This type of flooding is becoming increasingly common in places like Miami, impacting daily life and infrastructure even on sunny days. NOAA’s interactive products illustrate the frequency of tidally driven high-tide flooding.
- Land Subsidence: This is a local geological factor where the land itself sinks. While not as pronounced in Florida as in some other regions like Louisiana, it can exacerbate relative sea-level rise. When the land sinks, even if the absolute sea level hasn’t changed much, the water level relative to the land surface increases, making the area more susceptible to flooding. Accounting for land subsidence is crucial for accurate flood risk assessments. For instance, change uncertainties in regional models, such as those in Louisiana, can range from 20 to 50 centimeters, often attributable to subsidence.
In summary, the future of Coastal flood risk points towards higher water levels, more frequent tidal flooding, and potentially more impactful storm events. These changes necessitate a proactive approach to understanding and mitigating risks.
Projecting the Future: Sea-Level Rise Scenarios
To prepare effectively, we need to look ahead. Different sea-level rise scenarios, often based on IPCC reports and various warming choices, help us explore future coastal flood threats. For example, the Global Flood Maps dataset includes maps for the present climate (ca. 2018) and future climate (ca. 2050), with the 2050 scenario assuming sea level rise as estimated under RCP8.5 (a high-emission scenario).
These scenarios allow us to understand potential outcomes based on different greenhouse gas emission pathways and their corresponding global warming levels. For Miami, these projections from reports like the 2022 Sea Level Rise Technical Report are vital for long-term planning and infrastructure development. They help us envision what our coastline might look like decades from now, guiding decisions on everything from building codes to insurance strategies.
The Science of Prediction: How Flood Risk is Modeled
Understanding Coastal flood risk requires sophisticated tools and data. Flood modeling combines scientific principles with advanced computational techniques to predict how water will behave and where it will go during a flood event. At the heart of accurate flood modeling are high-quality Digital Elevation Models (DEMs), bathymetry data, and precise data resolution.
The Power of Precision: Advanced Datasets
The accuracy of any flood map is only as good as the elevation data it’s built upon. This is where advanced datasets like CoastalDEM® come into play.
- CoastalDEM®: Developed by Climate Central, CoastalDEM® is a proprietary, high-accuracy digital elevation model (DEM) specifically designed for coastal areas. It leverages machine learning to significantly improve upon existing global DEMs. For instance, it reduces median errors in NASA’s NASADEM to near zero, outperforming other prevalent global DEMs. This precision is critical because even small errors in elevation data can dramatically alter flood inundation predictions, especially in low-lying coastal regions like Miami where a few inches can mean the difference between dry land and submerged property. Climate Central’s maps, which use CoastalDEM®, are based on the latest sea-level projections from the IPCC and the U.S. government’s 2022 Sea Level Rise Technical Report. These advancements reveal a greater risk from sea level rise and coastal flooding than previously understood.
- Lidar Data: For even greater local detail, airborne lidar data is invaluable. NOAA, for example, uses high-resolution airborne lidar data to map coastal flood risk within the U.S. Lidar provides highly accurate, detailed elevation measurements of both land and shallow seafloor (bathymetry), which are essential for understanding how water will flow and accumulate.
Global vs. Local Models: Knowing When to Zoom In
While global flood models provide a broad overview, they often have limitations that necessitate local-scale modeling for truly accurate risk assessment.
The Global Flood Maps dataset, developed by Deltares, is a valuable tool. It offers maps for present and future climates (e.g., 2050 under RCP8.5), with extreme water levels corresponding to various return periods (2, 5, 10, 25, 50, 100, and 250 years). The dataset is based on the GTSMv3.0 (Global Tide and Surge model), forced with ERA5 reanalysis atmospheric data, and uses a static inundation routine (the ‘bathtub’ method) over a high-resolution DEM.
However, it’s crucial to understand its limitations:
- Excludes man-made protections: The Global Flood Maps dataset does not account for man-made coastal protections (e.g., dams, storm barriers, seawalls). This is a significant limitation, as these structures can drastically alter local flood patterns.
- Simplified friction: It applies a simplified correction for friction over land, which might not accurately represent complex urban or natural landscapes.
- Reduced accuracy in complex bathymetries: Its performance may be reduced in areas with complex bathymetries, such as estuaries or semi-enclosed bays, where water dynamics are more intricate.
- Resolution limitations: While the flood maps have a resolution of 3 arcseconds (30-75 m in Europe), local models can often achieve much finer resolutions (e.g., 1-2m for lidar-derived data).
For these reasons, local-scale modeling becomes essential. Local models can incorporate more detailed topography and bathymetry, account for specific man-made protections, and use higher-resolution data. They can also leverage global model results as boundary conditions, refining predictions for specific communities like those along the Miami coastline. This granular detail allows for a much more accurate estimate of Coastal flood risk and informs targeted mitigation strategies.
Reading the Maps: How to Interpret Your Flood Risk
Understanding Coastal flood risk goes beyond simply knowing that you’re in a flood zone. It involves interpreting the nuances of flood maps, which use specific terminology and projections to describe potential hazards.
Flood maps come in various forms, including inundation maps (showing areas covered by water) and flood hazard maps (indicating the probability and depth of flooding). Key terms you’ll encounter are “return periods” and “Annual Exceedance Probability (AEP).” For instance, a 100-year flood zone indicates an area with a 1% AEP, meaning there’s a 1 in 100 chance of a flood of that magnitude occurring in any given year.
When reviewing these maps for your Miami property, pay close attention to:
- Water depth: How deep is the projected floodwater? This directly impacts property damage.
- Elevation data: The accuracy of the underlying DEM is paramount. As we discussed, higher resolution data like CoastalDEM® provides a more realistic picture.
- Local survey data: This is critical. Maps are general, but local surveys can confirm specific elevations and drainage patterns on your property.
Tools for Assessing Your Local Coastal Flood Risk
Fortunately, there are powerful tools available to help us visualize and understand our local Coastal flood risk:
- NOAA Sea Level Rise Viewer: This interactive tool is invaluable for Miami residents. It has been continually updated with new elevation data and VDatum tidal surfaces for Florida, allowing us to visualize potential coastal inundation under various sea-level rise scenarios. It also provides tutorials on local scenarios and marsh migration, and historical data on high tide flooding. The NOAA Sea Level Rise Viewer was updated in March 2022 with new sea level rise scenarios from the 2022 Sea Level Rise Technical Report for Alabama, Florida, Puerto Rico, U.S. Virgin Islands, and New Jersey. You can also explore local scenarios and marsh migration mapping.
- FEMA Flood Maps: These are the official maps used for flood insurance purposes. While based on historical data and often not fully incorporating future sea-level rise projections, they define regulatory flood zones and influence insurance rates.
- Climate Central Surging Seas: This tool, powered by CoastalDEM®, offers an interactive map showing areas threatened by sea level rise and coastal flooding with great accuracy. It allows for exploration of flood threats based on different time horizons, water levels, warming scenarios, and pollution pathways.
- Local Government Portals: Miami-Dade County and the City of Miami Beach also provide local resources and maps related to sea-level rise and flood awareness. These are crucial for understanding specific local regulations and initiatives.
These tools allow us to explore maps showing exposure to coastal flood hazards and identify impacts on people, places, and natural resources.
The Human Element: Why Local Knowledge Matters
Even with the most advanced modeling, the “human element” remains crucial for accurate Coastal flood risk assessment. Global flood models, as noted, often suffer from the exclusion of man-made protections. A global map might show an area as flooded, but a local seawall or levee could be protecting it. Conversely, a map might not show flooding, but a failing drainage system or an unmapped low point could lead to inundation.
Consider bridges: a map might show a bridge as flooded because the land beneath it is inundated, even if the bridge deck itself is above water. This highlights why local survey data is so important for interpreting flood maps accurately. Surveying your property’s exact elevation, noting the condition of nearby flood defenses, and understanding local drainage can provide invaluable context that no broad-scale map can offer.
Furthermore, integrating community observations and Indigenous knowledge can fill critical gaps. Projects like MASAK, which focuses on understanding coastal flooding in Nunavik communities, highlight the value of local input. Residents often have generations of observations on water levels, erosion patterns, and historical flood events that scientific models may not capture. While the MASAK project is in Canada, the principle applies universally: local communities are often the first to notice subtle changes in their environment, and their insights can be vital for painting a complete picture of Coastal flood risk and developing truly effective adaptation strategies.
From Data to Decisions: Planning for a Resilient Coastline
Armed with a better understanding of Coastal flood risk and how to interpret the available data, the next critical step is to translate this knowledge into actionable decisions. Proactive planning and adaptation strategies are essential for building a resilient coastline in Miami.
Adaptation strategies include:
- Land-use planning and zoning regulations: These can guide development away from the most vulnerable areas, restrict building in flood zones, or require liftd construction.
- Infrastructure improvements: Investing in updated stormwater systems, elevating roads, or constructing/reinforcing sea walls and levees.
- Nature-based solutions: These leverage natural systems to reduce flood risk.
Nature-based solutions, such as restoring mangrove forests or creating “living shorelines” with salt marshes, are particularly effective. These natural buffers can absorb wave energy, trap sediment, and slow down floodwaters, providing both ecological benefits and flood protection. They offer a sustainable and often more resilient alternative or complement to traditional “grey infrastructure” like concrete walls.
Building community resilience means a multi-faceted approach that considers both engineered solutions and ecological restoration, all guided by sound data and forward-thinking policies.
Best Practices for Communicating Risk
Effective communication of Coastal flood risk is paramount to ensure that diverse stakeholders, from individual homeowners to policymakers, understand the threats and are motivated to act. Here are some best practices:
- Clear Terminology: Define terms like “100-year flood” or “AEP” clearly, avoiding jargon. The Flood Literacy Story Map by NOAA aims to provide consistent, scientifically accurate definitions.
- Visual Tools: Use interactive maps and visualizations like the NOAA Sea Level Rise Viewer. These tools make complex data accessible and help people see the potential impacts on their own properties.
- Custom Messaging: Understand your audience. What motivates a homeowner might be different from what motivates a city planner or a business owner.
- Actionable Advice: Don’t just present the problem; offer clear steps individuals and communities can take. This includes guidance on preparing for floods, understanding insurance, and participating in local planning efforts.
- Community Engagement: Foster open dialogues through workshops, public meetings, and online forums. The Coastal Inundation Community of Practice is a national network that facilitates peer-to-peer learning and information exchange to advance coastal flooding science, knowledge, and solutions. We all have a role to play in facing the challenges of floods.
Frequently Asked Questions about Coastal Flooding
We often hear similar questions from our clients in Miami about Coastal flood risk. Let’s address some of the most common ones.
What is the difference between a 100-year flood and a 1% AEP flood?
This is a crucial distinction that often causes confusion.
- 100-year flood: This term is widely used but often misinterpreted. It does NOT mean a flood that happens only once every 100 years. Instead, it refers to a flood event that has a 1 in 100 chance of occurring in any given year.
- 1% AEP (Annual Exceedance Probability): This is the more accurate and preferred terminology. It means there is a 1% probability that a flood of a certain magnitude (or greater) will occur in any given year. So, a 1% AEP flood is the same as a 100-year flood. The key takeaway is that such an event could happen multiple times in a decade, or not at all for centuries. The probability remains 1% each year, regardless of when the last one occurred. Given the increasing frequency of high-tide flooding, we encourage everyone to understand this statistical likelihood.
Do standard flood maps account for sea-level rise?
Generally, no, not fully. Most traditional FEMA flood maps are based on historical flood events and current flood risk assessments, making them somewhat static. They don’t typically project future conditions, including anticipated sea-level rise.
However, newer tools and resources do incorporate future sea-level rise:
- NOAA Sea Level Rise Viewer: This tool specifically allows you to visualize potential inundation with various increments of future sea-level rise.
- Climate Central Surging Seas: Similarly, this platform integrates future sea-level projections into its risk maps.
Therefore, while standard regulatory maps are important for insurance and building codes, we advise using these forward-looking tools to get a more comprehensive picture of your future Coastal flood risk, especially in areas like Miami experiencing rapid sea-level change.
How do seawalls and levees affect my property’s flood risk?
Man-made coastal protections like seawalls, levees, and dunes are designed to reduce Coastal flood risk by blocking or diverting floodwaters. They can significantly lower the risk of inundation for properties behind them.
However, understand a few critical points:
- Limitations of global models: As discussed, many global flood models do not account for these structures, so a global map might show an area flooded that is, in fact, protected. This underscores the importance of local survey data and verifying the presence and condition of such defenses.
- Potential for failure: No protection structure is foolproof. Overtopping, structural failure due to extreme events, or deterioration over time can lead to catastrophic flooding. This is known as residual risk.
- Maintenance: These structures require ongoing maintenance and monitoring to ensure their effectiveness.
- Local context: The effectiveness of a seawall depends on its height, design, and the specific flood event. A seawall might protect against daily high tides but be overtopped by a powerful hurricane storm surge.
Therefore, while seawalls and levees offer valuable protection, they should be considered as one component of a broader flood risk management strategy, and their presence doesn’t eliminate Coastal flood risk entirely.
Conclusion: Securing Your Future on the Coast
Understanding your Coastal flood risk is not just an academic exercise; it’s the first, most crucial step toward protecting your home, your business, and your peace of mind in Miami. As we’ve explored, this risk is driven by a complex interplay of sea-level rise, changing storm patterns, and local geological factors, all of which are projected to increase in the coming years.
Fortunately, advancements in modeling techniques, high-resolution elevation data like CoastalDEM®, and interactive tools from NOAA and Climate Central provide us with unprecedented insights into current and future flood threats. However, global models have limitations; local-scale modeling, on-the-ground surveys, and invaluable community observations are essential for a truly accurate assessment.
Proactive planning, including smart land-use decisions, embracing nature-based solutions, and clear communication of risk, will be vital for building a resilient coastline. At PTL Insurance Associates, Inc., we understand that navigating these complexities can be daunting. That’s why we’re committed to providing personalized service and tailoring coverage options that truly protect your assets against the changing challenges of Coastal flood risk. Let us help you assess your specific exposure and secure your financial future.

